Functions | |
| prepare_data () | |
| reset_output () | |
| plotMultivariable (scenarios_h, variables_h, region, title, filename, printLegend=True, fwidth=10, fheight=15) | |
| plotCarbonChart (scenarios_h, region, title, filename) | |
| plotLegend (scenarios_h, filename, title_h="") | |
| plotVectorChart_inner (origin, end1, endt, xlabel, ylabel, filename, comp1_color='red', totcomp_color='blue', diffcomp_color='green') | |
| printTable (ref_scenario, comparing_scenarios, variables_h, regions_h, years_h, title, filename, singleComparation=False, refYear=0) | |
| printAATable (ref_scenarios, comparing_scenarios, regions_h, years_h, title, filename, refYear=0) | |
| printCarbonTable (ref_scenario, comparing_scenarios, region, year_start, year_end, title, filename, avg=False, singleComparation=True) | |
| printTableRecord (cvar_label, d, el, nscen, valRScenario, valCScenarios, singleComparation) | |
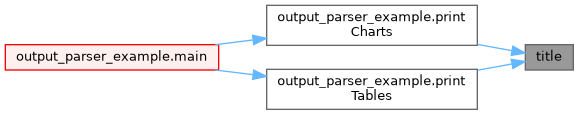
| title (cat, level, title) | |
| text (cat, text_h) | |
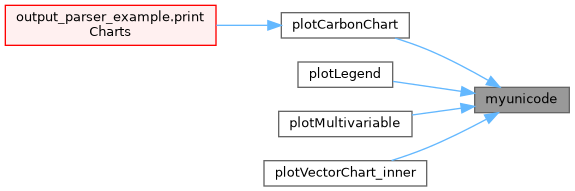
| myunicode (astring) | |
Function Documentation
◆ myunicode()
| myunicode | ( | astring | ) |
Definition at line 868 of file output_parser_lib.py.
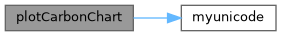
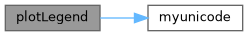
Referenced by plotCarbonChart(), plotLegend(), plotMultivariable(), and plotVectorChart_inner().
◆ plotCarbonChart()
| plotCarbonChart | ( | scenarios_h, | |
| region, | |||
| title, | |||
| filename | |||
| ) |
Definition at line 278 of file output_parser_lib.py.
Referenced by output_parser_example.printCharts().

◆ plotLegend()
| plotLegend | ( | scenarios_h, | |
| filename, | |||
title_h = "" |
|||
| ) |
Definition at line 387 of file output_parser_lib.py.
◆ plotMultivariable()
| plotMultivariable | ( | scenarios_h, | |
| variables_h, | |||
| region, | |||
| title, | |||
| filename, | |||
printLegend = True, |
|||
fwidth = 10, |
|||
fheight = 15 |
|||
| ) |
Definition at line 223 of file output_parser_lib.py.
◆ plotVectorChart_inner()
| plotVectorChart_inner | ( | origin, | |
| end1, | |||
| endt, | |||
| xlabel, | |||
| ylabel, | |||
| filename, | |||
comp1_color = 'red', |
|||
totcomp_color = 'blue', |
|||
diffcomp_color = 'green' |
|||
| ) |
Plot a 2-d vector difference
# @params:
# origin: x and y of the origin of the vectors
# end1:  (x,y) coordinates of the ending of the first component vector
# end2:  (x,y) coordinates of the ending of the total component of the vector
# xlabel: xlabel
# ylabel: ylabel
# filename: filename
# totcomp_color: color (English or #HTML_code) of the vector representing the total component
# comp1_color: color (English or #HTML_code) of the vector representing the first component
# diffcomp_color: color (English or #HTML_code) of the vector representing the difference component
Definition at line 433 of file output_parser_lib.py.
◆ prepare_data()
| prepare_data | ( | ) |
Definition at line 19 of file output_parser_lib.py.
Referenced by output_parser_example.main().

◆ printAATable()
| printAATable | ( | ref_scenarios, | |
| comparing_scenarios, | |||
| regions_h, | |||
| years_h, | |||
| title, | |||
| filename, | |||
refYear = 0 |
|||
| ) |
Definition at line 608 of file output_parser_lib.py.
◆ printCarbonTable()
| printCarbonTable | ( | ref_scenario, | |
| comparing_scenarios, | |||
| region, | |||
| year_start, | |||
| year_end, | |||
| title, | |||
| filename, | |||
avg = False, |
|||
singleComparation = True |
|||
| ) |
Definition at line 681 of file output_parser_lib.py.
Referenced by output_parser_example.printTables().

◆ printTable()
| printTable | ( | ref_scenario, | |
| comparing_scenarios, | |||
| variables_h, | |||
| regions_h, | |||
| years_h, | |||
| title, | |||
| filename, | |||
singleComparation = False, |
|||
refYear = 0 |
|||
| ) |
Print a LaTeX Table for variables variable_h comparing ref_scenario scenario vs coparing_scenarios.
@param singleComparation: if True multiple comparing scenarios are treated as multiple replications of the same scenario and
some basic stats are computed; if False they are all represented as diff from the ref_scenario.
@param refYear: if 0 reference vs comparing scenarios are compared on the same year (or average of years if years_h has length > 1.).
Otherwise the comparing scneario at year(s) years_h is compared with reference scenario at year refYear (useful to see the dynamic
effects within a single scenario)
Definition at line 503 of file output_parser_lib.py.
Referenced by output_parser_example.printTables().

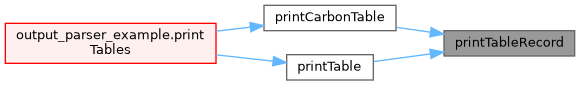
◆ printTableRecord()
| printTableRecord | ( | cvar_label, | |
| d, | |||
| el, | |||
| nscen, | |||
| valRScenario, | |||
| valCScenarios, | |||
| singleComparation | |||
| ) |
Definition at line 802 of file output_parser_lib.py.
Referenced by printCarbonTable(), and printTable().
◆ reset_output()
| reset_output | ( | ) |
Definition at line 213 of file output_parser_lib.py.
Referenced by output_parser_example.main().

◆ text()
| text | ( | cat, | |
| text_h | |||
| ) |
Definition at line 854 of file output_parser_lib.py.
◆ title()
| title | ( | cat, | |
| level, | |||
| title | |||
| ) |
Definition at line 838 of file output_parser_lib.py.
Referenced by output_parser_example.printCharts(), and output_parser_example.printTables().